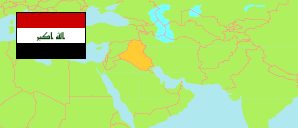
Dhī Qār
Governorate in Iraq
Contents: Subdivision
The population development in Dhī Qār as well as related information and services (Wikipedia, Google, images).
| Name | Status | Native | Population Estimate 2009-10-17 | Population Estimate 2018-07-01 | |
|---|---|---|---|---|---|
| Dhī Qār [Theqar] | Governorate | ذي قار | 1,744,398 | 2,095,172 | |
| Ad-Dawāyah | Central Subdistrict | الدوایة | 74,887 | 88,883 | → |
| Al-Baṭḥā'a | Subdistrict | البطحاء | 40,881 | 48,797 | → |
| Al-Faḍliyah | Subdistrict | الفضلیة | 48,030 | 56,596 | → |
| Al-Fajr | Subdistrict | الفجر | 52,982 | 62,987 | → |
| Al-Fuhūd | Central Subdistrict | الفھود | 39,769 | 47,639 | → |
| Al-Gharrāf | Subdistrict | الغراف | 103,752 | 122,934 | → |
| Al-Ḥamār | Subdistrict | الحمار | 8,178 | 9,923 | → |
| Al-Iṣlāḥ | Central Subdistrict | الاصلاح | 39,093 | 46,196 | → |
| Al-Jibāyish | Central Subdistrict | الجبایش | 37,278 | 45,230 | → |
| An-Nāṣiriyah [Nasiriyah] | Central Subdistrict | الناصرية | 455,721 | 558,446 | → |
| An-Naṣr | Subdistrict | النصر | 86,898 | 103,521 | → |
| Ar-Rifā'ī | Central Subdistrict | الرفاعي | 136,086 | 161,829 | → |
| Ash-Shaṭrah | Central Subdistrict | الشطرة | 206,483 | 249,235 | → |
| Aṭ-Ṭār | Subdistrict | الطار | 17,631 | 20,686 | → |
| 'Aūr | Subdistrict | أور | 55,890 | 65,090 | → |
| Karmat Banī Sa'īd | Subdistrict | كرمة بني سعید | 52,271 | 61,527 | → |
| Qal'at Sikar | Central Subdistrict | قلعة سكر | 87,545 | 104,392 | → |
| Saīd Dakhīl | Central Subdistrict | سید دخیل | 51,552 | 60,612 | → |
| Sūq ash-Shuyūkh | Central Subdistrict | سوق الشیوخ | 107,373 | 131,576 | → |
| 'Ukaīkah | Subdistrict | عكیكة | 42,098 | 49,073 | → |
| Al-'Irāq [Iraq] | Republic | 31,664,466 | 38,124,182 |
Source: Central Organization for Statistics and Information Technology (web).
Explanation: Area figures of subdistricts are computed by using geospatial data.