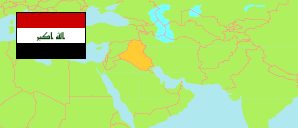
An-Najaf
Governorate in Iraq
Contents: Subdivision
The population development in An-Najaf as well as related information and services (Wikipedia, Google, images).
| Name | Status | Native | Population Estimate 2009-10-17 | Population Estimate 2018-07-01 | |
|---|---|---|---|---|---|
| An-Najaf | Governorate | النجف | 1,221,228 | 1,471,592 | |
| Al-'Abāsiyah | Subdistrict | العباسیة | 78,782 | 94,037 | → |
| Al-Ḥaydariyah | Subdistrict | الحیدریة | 45,854 | 54,901 | → |
| Al-Ḥīrah | Subdistrict | الحیرة | 33,431 | 40,108 | → |
| Al-Ḥuriyah | Subdistrict | الحریة | 26,331 | 31,557 | → |
| Al-Kūfah | Central Subdistrict | الكوفة | 200,819 | 241,964 | → |
| Al-Manādhirah | Central Subdistrict | المناذرة | 77,784 | 93,142 | → |
| Al-Mishkhāb | Central Subdistrict | المشخاب | 77,949 | 93,319 | → |
| Al-Qādisiyah | Subdistrict | القادسیة | 39,230 | 46,813 | → |
| An-Najaf [Najaf] | Central Subdistrict | النجف | 640,664 | 775,286 | → |
| Ash-Shabakah | Subdistrict | الشبكة | 384 | 465 | → |
| Al-'Irāq [Iraq] | Republic | 31,664,466 | 38,124,182 |
Source: Central Organization for Statistics and Information Technology (web).
Explanation: Area figures of subdistricts are computed by using geospatial data.