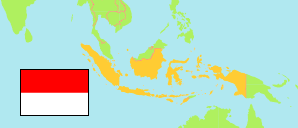
Aceh
Special Region in Indonesia
Contents: Subdivision
The population development in Aceh as well as related information and services (Wikipedia, Google, images).
| Name | Status | Population Census 2005-06-30 | Population Census 2010-05-01 | Population Census 2015-05-01 | Population Census 2020-09-15 | |
|---|---|---|---|---|---|---|
| Aceh (Nanggroe Aceh Darussala) | Special Region | 4,031,589 | 4,494,410 | 4,993,385 | 5,274,871 | |
| Aceh Barat [West Aceh] | Regency | 150,450 | 173,558 | 193,484 | 198,736 | → |
| Aceh Barat Daya [Southwest Aceh] | Regency | 115,676 | 126,036 | 140,366 | 150,775 | → |
| Aceh Besar | Regency | 296,541 | 351,418 | 391,870 | 405,535 | → |
| Aceh Jaya | Regency | 60,660 | 76,782 | 86,368 | 93,159 | → |
| Aceh Selatan [South Aceh] | Regency | 191,539 | 202,251 | 224,588 | 232,414 | → |
| Aceh Singkil | Regency | ... | 102,509 | 114,326 | 126,514 | → |
| Aceh Tamiang | Regency | 235,314 | 251,914 | 277,766 | 294,356 | → |
| Aceh Tengah [Central Aceh] | Regency | 160,549 | 175,527 | 195,790 | 215,576 | → |
| Aceh Tenggara [Southeast Aceh] | Regency | 169,053 | 179,010 | 199,646 | 220,860 | → |
| Aceh Timur [East Aceh] | Regency | 304,643 | 360,475 | 402,300 | 422,401 | → |
| Aceh Utara [North Aceh] | Regency | 493,670 | 529,751 | 582,899 | 602,793 | → |
| Bener Meriah | Regency | 106,148 | 122,277 | 136,570 | 161,342 | → |
| Bireuen | Regency | 351,835 | 389,288 | 434,283 | 436,418 | → |
| Gayo Lues | Regency | 72,045 | 79,560 | 87,736 | 99,532 | → |
| Kota Banda Aceh | City | 177,881 | 223,446 | 250,227 | 252,899 | → |
| Kota Langsa | City | 137,586 | 148,945 | 165,534 | 185,971 | → |
| Kota Lhokseumawe | City | 154,634 | 171,163 | 191,104 | 188,713 | → |
| Kota Sabang | City | 28,597 | 30,653 | 33,054 | 41,197 | → |
| Kota Subulussalam | City | ... | 67,446 | 75,044 | 90,751 | → |
| Nagan Raya | Regency | 123,743 | 139,663 | 154,879 | 168,392 | → |
| Pidie | Regency | ... | 379,108 | 418,173 | 435,275 | → |
| Pidie Jaya | Regency | ... | 132,956 | 148,394 | 158,397 | → |
| Simeulue | Regency | 78,389 | 80,674 | 88,984 | 92,865 | → |
| Indonesia | Republic | 218,868,791 | 237,641,326 | 255,182,144 | 270,203,917 |
Source: Badan Pusat Statistik, Republik Indonesia (web).
Explanation: 2005 and 2015 figures are result of an intermediate census.
Further information about the population structure:
| Gender (C 2020) | |
|---|---|
| Males | 2,647,563 |
| Females | 2,627,308 |
| Age Groups (C 2020) | |
|---|---|
| 0-14 years | 1,461,114 |
| 15-59 years | 3,547,114 |
| 65+ years | 266,643 |
| Age Distribution (C 2020) | |
|---|---|
| 90+ years | 2,375 |
| 80-89 years | 31,489 |
| 70-79 years | 117,714 |
| 60-69 years | 274,779 |
| 50-59 years | 473,795 |
| 40-49 years | 682,744 |
| 30-39 years | 834,270 |
| 20-29 years | 919,850 |
| 10-19 years | 961,662 |
| 0-9 years | 976,193 |