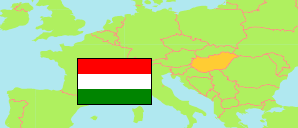
Gödöllő
District in Pest
District
The population development of Gödöllő.
| Name | Status | Population Census 1980-01-01 | Population Census 1990-01-01 | Population Census 2001-02-01 | Population Census 2011-10-01 | Population Census 2022-10-01 | |
|---|---|---|---|---|---|---|---|
| Gödöllő | District | 97,184 | 96,994 | 116,302 | 139,826 | 160,239 | → |
| Pest | County | 973,830 | 949,842 | 1,083,877 | 1,217,476 | 1,333,533 |
Contents: Towns and Villages
The population development of the towns and villages in Gödöllő.
| Name | Status | District | Population Census 1980-01-01 | Population Census 1990-01-01 | Population Census 2001-02-01 | Population Census 2011-10-01 | Population Census 2022-10-01 | |
|---|---|---|---|---|---|---|---|---|
| Csömör | Large Village | Gödöllő | 5,516 | 5,487 | 7,266 | 9,293 | 10,580 | → |
| Dány | Village | Gödöllő | 4,173 | 4,006 | 4,219 | 4,430 | 4,566 | → |
| Erdőkertes | Village | Gödöllő | 3,541 | 3,685 | 5,543 | 7,307 | 9,363 | → |
| Gödöllő | Town | Gödöllő | 28,096 | 28,195 | 31,105 | 32,522 | 32,625 | → |
| Isaszeg | Town | Gödöllő | 9,120 | 8,789 | 10,256 | 11,152 | 11,647 | → |
| Kerepes | Town | Gödöllő | 5,901 | 6,758 | 8,269 | 10,068 | 11,221 | → |
| Kistarcsa | Town | Gödöllő | 9,520 | 8,847 | 9,198 | 11,953 | 13,879 | → |
| Mogyoród | Large Village | Gödöllő | 3,308 | 3,295 | 4,755 | 6,437 | 8,084 | → |
| Nagytarcsa | Village | Gödöllő | 2,135 | 2,555 | 2,788 | 3,940 | 6,572 | → |
| Pécel | Town | Gödöllő | 11,029 | 10,751 | 12,696 | 15,168 | 17,565 | → |
| Szada | Large Village | Gödöllő | 2,229 | 2,215 | 3,174 | 4,721 | 6,293 | → |
| Vácszentlászló | Village | Gödöllő | 1,901 | 1,795 | 1,981 | 1,993 | 2,153 | → |
| Valkó | Large Village | Gödöllő | 2,251 | 2,084 | 2,424 | 2,436 | 2,529 | → |
| Veresegyház | Town | Gödöllő | 6,019 | 6,373 | 10,256 | 15,998 | 20,764 | → |
| Zsámbok | Village | Gödöllő | 2,445 | 2,159 | 2,372 | 2,408 | 2,398 | → |
Source: Hungarian Central Statistical Office.
Explanation: 2022 census results are final.