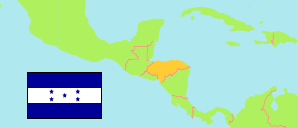
Atlántida
Department in Honduras
Contents: Subdivision
The population development in Atlántida as well as related information and services (Wikipedia, Google, images).
| Name | Status | Population Census 2001-07-28 | Population Census 2013-08-10 | Population Projection 2023-07-01 | |
|---|---|---|---|---|---|
| Atlántida | Department | 344,099 | 436,252 | 508,228 | |
| Arizona | Municipality | 20,670 | 23,714 | 26,117 | → |
| El Porvenir | Municipality | 15,444 | 21,854 | 28,391 | → |
| Esparta | Municipality | 17,614 | 18,447 | 20,796 | → |
| Jutiapa | Municipality | 30,226 | 34,224 | 39,326 | → |
| La Ceiba | Municipality | 140,931 | 197,267 | 232,696 | → |
| La Masica | Municipality | 25,509 | 29,427 | 33,521 | → |
| San Francisco | Municipality | 11,206 | 14,559 | 17,127 | → |
| Tela | Municipality | 82,499 | 96,758 | 110,255 | → |
| Honduras | Republic | 6,535,344 | 8,303,771 | 9,745,149 |
Source: Instituto Nacional de Estadística Honduras (web).
Explanation: All population figures are adjusted for underenumeration.
Further information about the population structure:
| Gender (P 2023) | |
|---|---|
| Males | 245,252 |
| Females | 262,976 |
| Age Groups (P 2023) | |
|---|---|
| 0-14 years | 151,985 |
| 15-64 years | 322,974 |
| 65+ years | 33,269 |
| Age Distribution (P 2023) | |
|---|---|
| 80+ years | 7,638 |
| 70-79 years | 14,590 |
| 60-69 years | 24,759 |
| 50-59 years | 36,853 |
| 40-49 years | 53,355 |
| 30-39 years | 75,221 |
| 20-29 years | 92,574 |
| 10-19 years | 101,818 |
| 0-9 years | 101,420 |
| Urbanization (P 2023) | |
|---|---|
| Rural | 164,626 |
| Urban | 343,602 |
| Place of Birth (C 2013) | |
|---|---|
| Same municipality | 298,636 |
| Other municipality in Honduras | 135,286 |
| Other country | 2,328 |
| Ethnic Group (C 2013) | |
|---|---|
| Indigenous | 21,239 |
| Non-Indigenous | 415,013 |