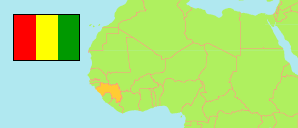
Mamou
Prefecture in Guinea
Contents: Subdivision
The population development in Mamou as well as related information and services (Wikipedia, Google, images).
| Name | Status | Population Census 1996-12-31 | Population Census 2014-03-01 | |
|---|---|---|---|---|
| Mamou | Prefecture | 236,326 | 318,981 | |
| Bouliwel | Sub-Prefecture | 15,685 | 20,881 | → |
| Dounet | Sub-Prefecture | 21,056 | 30,534 | → |
| Gongoret | Sub-Prefecture | 8,245 | 8,731 | → |
| Kégnéko | Sub-Prefecture | 13,495 | 19,134 | → |
| Konkouré | Sub-Prefecture | 8,920 | 13,039 | → |
| Mamou-Centre | Urban Commune | 63,692 | 83,008 | → |
| Nyagara | Sub-Prefecture | 12,366 | 12,319 | → |
| Ouré-Kaba | Sub-Prefecture | 22,473 | 31,804 | → |
| Porédaka | Sub-Prefecture | 21,006 | 22,153 | → |
| Saramoussaya | Sub-Prefecture | 14,326 | 23,216 | → |
| Soyah | Sub-Prefecture | 14,928 | 22,782 | → |
| Téguéréya | Sub-Prefecture | 5,641 | 9,298 | → |
| Timbo | Sub-Prefecture | 10,835 | 13,364 | → |
| Tolo | Sub-Prefecture | 7,388 | 8,718 | → |
| Guinea | Republic | 7,156,406 | 10,523,261 |
Source: Institut National de la Statistique de Guinée (web).
Explanation: The 1996 population of sub-prefectures and urban communes shows slight discrepancies compared to the population of prefectures.
Further information about the population structure:
| Gender (C 2014) | |
|---|---|
| Males | 148,157 |
| Females | 170,824 |
| Age Groups (P 2014) | |
|---|---|
| 0-14 years | 165,053 |
| 15-64 years | 174,850 |
| 65+ years | 20,796 |
| Age Distribution (P 2014) | |
|---|---|
| 0-9 years | 114,520 |
| 10-19 years | 80,224 |
| 20-29 years | 43,098 |
| 30-39 years | 38,294 |
| 40-49 years | 30,852 |
| 50-59 years | 23,347 |
| 60-69 years | 16,641 |
| 70-79 years | 9,939 |
| 80+ years | 3,784 |
| Urbanization (C 2014) | |
|---|---|
| Rural | 250,842 |
| Urban | 68,139 |