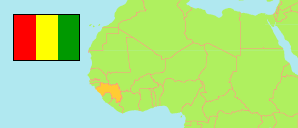
Dalaba
Prefecture in Guinea
Contents: Subdivision
The population development in Dalaba as well as related information and services (Wikipedia, Google, images).
| Name | Status | Population Census 1996-12-31 | Population Census 2014-03-01 | |
|---|---|---|---|---|
| Dalaba | Prefecture | 136,656 | 133,677 | |
| Bodié | Sub-Prefecture | 10,116 | 8,967 | → |
| Dalaba-Centre | Urban Commune | 20,871 | 24,193 | → |
| Ditinn | Sub-Prefecture | 16,104 | 13,121 | → |
| Kaala | Sub-Prefecture | 7,496 | 7,024 | → |
| Kankalabé | Sub-Prefecture | 16,781 | 15,955 | → |
| Kébali | Sub-Prefecture | 13,825 | 11,540 | → |
| Koba | Sub-Prefecture | 13,418 | 16,876 | → |
| Mafara | Sub-Prefecture | 8,604 | 8,182 | → |
| Mitty | Sub-Prefecture | 18,284 | 13,737 | → |
| Mombéyah | Sub-Prefecture | 13,636 | 14,082 | → |
| Guinea | Republic | 7,156,406 | 10,523,261 |
Source: Institut National de la Statistique de Guinée (web).
Explanation: The 1996 population of sub-prefectures and urban communes shows slight discrepancies compared to the population of prefectures.
Further information about the population structure:
| Gender (C 2014) | |
|---|---|
| Males | 59,852 |
| Females | 73,825 |
| Age Groups (P 2014) | |
|---|---|
| 0-14 years | 67,099 |
| 15-64 years | 71,609 |
| 65+ years | 12,446 |
| Age Distribution (P 2014) | |
|---|---|
| 0-9 years | 46,433 |
| 10-19 years | 31,874 |
| 20-29 years | 14,934 |
| 30-39 years | 14,980 |
| 40-49 years | 13,693 |
| 50-59 years | 11,855 |
| 60-69 years | 9,199 |
| 70-79 years | 5,738 |
| 80+ years | 2,448 |
| Urbanization (C 2014) | |
|---|---|
| Rural | 125,128 |
| Urban | 8,549 |