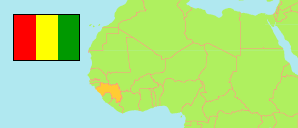
Labé
Prefecture in Guinea
Contents: Subdivision
The population development in Labé as well as related information and services (Wikipedia, Google, images).
| Name | Status | Population Census 1996-12-31 | Population Census 2014-03-01 | |
|---|---|---|---|---|
| Labé | Prefecture | 251,702 | 318,938 | |
| Dalein | Sub-Prefecture | 20,262 | 17,733 | → |
| Daralabe | Sub-Prefecture | 9,510 | 9,087 | → |
| Diari | Sub-Prefecture | 13,335 | 14,705 | → |
| Dionfo | Sub-Prefecture | 11,633 | 12,633 | → |
| Garambé | Sub-Prefecture | 8,126 | 9,418 | → |
| Hafia | Sub-Prefecture | 14,557 | 14,497 | → |
| Kaalan | Sub-Prefecture | 9,157 | 10,213 | → |
| Kouramangui | Sub-Prefecture | 15,222 | 14,498 | → |
| Labé-Centre | Urban Commune | 80,012 | 141,730 | → |
| Noussy | Sub-Prefecture | 14,981 | 13,797 | → |
| Popodara | Sub-Prefecture | 23,994 | 24,857 | → |
| Sannou | Sub-Prefecture | 18,866 | 20,463 | → |
| Tountouroun | Sub-Prefecture | 15,338 | 15,307 | → |
| Guinea | Republic | 7,156,406 | 10,523,261 |
Source: Institut National de la Statistique de Guinée (web).
Explanation: The 1996 population of sub-prefectures and urban communes shows slight discrepancies compared to the population of prefectures.
Further information about the population structure:
| Gender (C 2014) | |
|---|---|
| Males | 143,583 |
| Females | 175,355 |
| Age Groups (P 2014) | |
|---|---|
| 0-14 years | 152,544 |
| 15-64 years | 184,902 |
| 65+ years | 22,077 |
| Age Distribution (P 2014) | |
|---|---|
| 0-9 years | 106,899 |
| 10-19 years | 80,930 |
| 20-29 years | 50,837 |
| 30-39 years | 38,251 |
| 40-49 years | 29,692 |
| 50-59 years | 22,277 |
| 60-69 years | 16,788 |
| 70-79 years | 9,896 |
| 80+ years | 3,953 |
| Urbanization (C 2014) | |
|---|---|
| Rural | 226,284 |
| Urban | 92,654 |