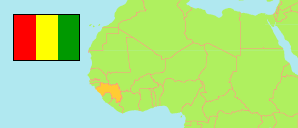
Kankan
Prefecture in Guinea
Contents: Subdivision
The population development in Kankan as well as related information and services (Wikipedia, Google, images).
| Name | Status | Population Census 1996-12-31 | Population Census 2014-03-01 | |
|---|---|---|---|---|
| Kankan | Prefecture | 262,350 | 473,359 | |
| Balandougou | Sub-Prefecture | 15,949 | 26,371 | → |
| Bate-Nafadji | Sub-Prefecture | 28,397 | 48,278 | → |
| Boula | Sub-Prefecture | 9,341 | 15,699 | → |
| Gbérédou-Baranama | Sub-Prefecture | 11,524 | 17,770 | → |
| Kankan-Centre | Urban Commune | 98,621 | 194,671 | → |
| Karifamoriyah | Sub-Prefecture | 15,306 | 24,785 | → |
| Koumban | Sub-Prefecture | 13,662 | 21,145 | → |
| Mamouroudou | Sub-Prefecture | 8,229 | 14,696 | → |
| Missamana | Sub-Prefecture | 9,400 | 17,962 | → |
| Moribayah | Sub-Prefecture | 7,079 | 14,385 | → |
| Sabadou-Baranama | Sub-Prefecture | 13,141 | 23,244 | → |
| Tinti-Oulen | Sub-Prefecture | 14,048 | 21,488 | → |
| Tokounou | Sub-Prefecture | 17,425 | 32,865 | → |
| Guinea | Republic | 7,156,406 | 10,523,261 |
Source: Institut National de la Statistique de Guinée (web).
Explanation: The 1996 population of sub-prefectures and urban communes shows slight discrepancies compared to the population of prefectures.
Further information about the population structure:
| Gender (C 2014) | |
|---|---|
| Males | 233,617 |
| Females | 239,742 |
| Age Groups (P 2014) | |
|---|---|
| 0-14 years | 256,326 |
| 15-64 years | 258,209 |
| 65+ years | 18,994 |
| Age Distribution (P 2014) | |
|---|---|
| 0-9 years | 188,655 |
| 10-19 years | 122,942 |
| 20-29 years | 84,230 |
| 30-39 years | 52,748 |
| 40-49 years | 34,211 |
| 50-59 years | 23,313 |
| 60-69 years | 15,440 |
| 70-79 years | 8,351 |
| 80+ years | 3,639 |
| Urbanization (C 2014) | |
|---|---|
| Rural | 282,637 |
| Urban | 190,722 |