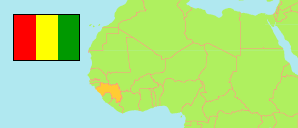
Boffa
Prefecture in Guinea
Contents: Subdivision
The population development in Boffa as well as related information and services (Wikipedia, Google, images).
| Name | Status | Population Census 1996-12-31 | Population Census 2014-03-01 | |
|---|---|---|---|---|
| Boffa | Prefecture | 156,558 | 212,583 | |
| Boffa-Centre | Urban Commune | 20,553 | 27,130 | → |
| Colia | Sub-Prefecture | 26,549 | 35,737 | → |
| Douprou | Sub-Prefecture | 14,514 | 21,405 | → |
| Koba-Tatema | Sub-Prefecture | 35,730 | 51,111 | → |
| Lisso | Sub-Prefecture | 7,983 | 11,830 | → |
| Mankountan | Sub-Prefecture | 14,097 | 17,148 | → |
| Tamita | Sub-Prefecture | 11,556 | 14,287 | → |
| Tougnifili | Sub-Prefecture | 27,294 | 33,935 | → |
| Guinea | Republic | 7,156,406 | 10,523,261 |
Source: Institut National de la Statistique de Guinée (web).
Explanation: The 1996 population of sub-prefectures and urban communes shows slight discrepancies compared to the population of prefectures.
Further information about the population structure:
| Gender (C 2014) | |
|---|---|
| Males | 104,347 |
| Females | 108,236 |
| Age Groups (P 2014) | |
|---|---|
| 0-14 years | 113,388 |
| 15-64 years | 117,700 |
| 65+ years | 9,289 |
| Age Distribution (P 2014) | |
|---|---|
| 0-9 years | 85,090 |
| 10-19 years | 51,265 |
| 20-29 years | 35,914 |
| 30-39 years | 26,247 |
| 40-49 years | 17,369 |
| 50-59 years | 10,828 |
| 60-69 years | 7,089 |
| 70-79 years | 4,255 |
| 80+ years | 2,320 |
| Urbanization (C 2014) | |
|---|---|
| Rural | 203,952 |
| Urban | 8,631 |