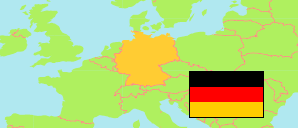
Oberbergischer Kreis
County in Nordrhein-Westfalen (Germany)
Contents: Population
The population development of Oberbergischer Kreis as well as related information and services (Wikipedia, Google, images).
| Name | Status | Population Estimate 1990-12-31 | Population Estimate 2001-12-31 | Population Census 2011-05-09 | Population Estimate 2021-12-31 | |
|---|---|---|---|---|---|---|
| Oberbergischer Kreis | County | 263,276 | 289,518 | 273,011 | 271,621 | |
| Deutschland [Germany] | Federal Republic | 79,753,227 | 82,440,309 | 80,219,695 | 83,237,124 |
Source: Statistisches Bundesamt Deutschland, Statistical Offices of the German States.
Explanation: States and counties in the boundaries of 31 December 2022.
Further information about the population structure:
| Gender (E 2021) | |
|---|---|
| Males | 133,578 |
| Females | 138,043 |
| Age Groups (E 2021) | |
|---|---|
| 0-17 years | 48,058 |
| 18-64 years | 163,740 |
| 65+ years | 59,823 |
| Age Distribution (E 2021) | |
|---|---|
| 90+ years | 2,837 |
| 80-89 years | 17,275 |
| 70-79 years | 23,057 |
| 60-69 years | 37,801 |
| 50-59 years | 44,910 |
| 40-49 years | 31,236 |
| 30-39 years | 31,815 |
| 20-29 years | 29,121 |
| 10-19 years | 26,450 |
| 0-9 years | 27,119 |
| Citizenship (E 2021) | |
|---|---|
| German | 244,303 |
| Foreign Citizenship | 27,318 |
| Country of Birth (C 2011) | |
|---|---|
| Germany | 217,118 |
| EU 27 | 16,568 |
| Europe (other) | 12,942 |
| Other country | 13,526 |
| Unknown | 12,857 |
| Religion (C 2011) | |
|---|---|
| Roman Catholic | 83,581 |
| Protestant | 103,240 |
| Other/No/Unknown | 86,190 |