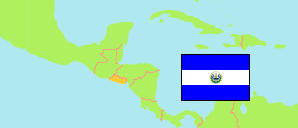
Chalatenango Centro
Municipality in El Salvador
Contents: Population
The population development of Chalatenango Centro as well as related information and services (Wikipedia, Google, images).
| Name | Status | Population Census 1992-09-27 | Population Projection 2007-06-30 | Population Projection 2024-06-30 | |
|---|---|---|---|---|---|
| Chalatenango Centro | Municipality | 82,916 | 94,832 | 85,089 | |
| El Salvador | Republic | 5,118,599 | 6,097,389 | 6,350,969 |
Source: Oficina Nacional de Estadística y Censos, El Salvador.
Explanation: The presented municipal division came into effect in May 2024. The 2024 population projection considers the revision of 2021. In contrast to the projection, the census figures are not adjusted for underenumeration.
Further information about the population structure:
| Gender (P 2024) | |
|---|---|
| Males | 39,780 |
| Females | 45,309 |
| Age Groups (P 2024) | |
|---|---|
| 0-14 years | 25,320 |
| 15-64 years | 52,197 |
| 65+ years | 7,572 |
| Age Distribution (P 2024) | |
|---|---|
| 80+ years | 1,978 |
| 70-79 years | 3,338 |
| 60-69 years | 4,894 |
| 50-59 years | 6,024 |
| 40-49 years | 5,808 |
| 30-39 years | 13,694 |
| 20-29 years | 16,363 |
| 10-19 years | 16,029 |
| 0-9 years | 16,961 |
| Urbanization (C 2007) | |
|---|---|
| Rural | 64,663 |
| Urban | 27,651 |
| Literacy (A10+) (C 2007) | |
|---|---|
| yes | 30,301 |
| no | 8,242 |