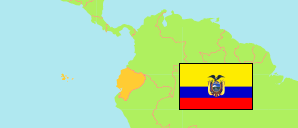
Tungurahua (Ecuador)
Province
The population development of Tungurahua.
| Name | Status | Population Census 1990-11-25 | Population Census 2001-11-25 | Population Census 2010-11-28 | Population Census 2022-10-01 | |
|---|---|---|---|---|---|---|
| Tungurahua (Tunkurawa) | Province | 368,511 | 441,034 | 504,583 | 563,532 | → |
| Ecuador | Republic | 9,697,979 | 12,156,608 | 14,483,499 | 16,938,986 |
Contents: Urban Places
The population development of the urban places in Tungurahua.
| Name | Status | Province | Population Census 1990-11-25 | Population Census 2001-11-25 | Population Census 2010-11-28 | Population Census 2022-10-01 | |
|---|---|---|---|---|---|---|---|
| Ambato (Ampatu) | Urban Place | Tungurahua | 124,166 | 154,095 | 165,185 | 177,316 | → |
| Baños de Agua Santa | Urban Place | Tungurahua | 9,501 | 10,439 | 12,995 | 14,100 | → |
| Cevallos | Urban Place | Tungurahua | 1,748 | 2,250 | 2,501 | 3,754 | → |
| Mocha | Urban Place | Tungurahua | 983 | 1,122 | 1,209 | 1,516 | → |
| Patate | Urban Place | Tungurahua | 1,577 | 1,795 | 2,161 | 2,514 | → |
| Pelileo | Urban Place | Tungurahua | 5,954 | 9,051 | 10,103 | 11,403 | → |
| Píllaro (Pillaru) | Urban Place | Tungurahua | 5,146 | 6,299 | 7,444 | 9,816 | → |
| Quero (Santiago de Quero, Santiago Kiru) | Urban Place | Tungurahua | 1,674 | 2,238 | 2,679 | 3,269 | → |
| Tisaleo | Urban Place | Tungurahua | 803 | 1,038 | 1,269 | 1,561 | → |
Source: Instituto Nacional de Estadística y Censos del Ecuador (web).
Explanation: Census figures are not adjusted for underenumeration. The urban population of the corresponding parish is tabulated.