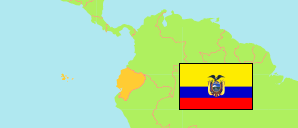
Imbabura (Ecuador)
Province
The population development of Imbabura.
| Name | Status | Population Census 1990-11-25 | Population Census 2001-11-25 | Population Census 2010-11-28 | Population Census 2022-10-01 | |
|---|---|---|---|---|---|---|
| Imbabura (Impapura) | Province | 278,240 | 348,105 | 403,546 | 469,879 | → |
| Ecuador | Republic | 9,697,979 | 12,156,608 | 14,483,499 | 16,938,986 |
Contents: Urban Places
The population development of the urban places in Imbabura.
| Name | Status | Province | Population Census 1990-11-25 | Population Census 2001-11-25 | Population Census 2010-11-28 | Population Census 2022-10-01 | |
|---|---|---|---|---|---|---|---|
| Atuntaqui (Hatuntaki) | Urban Place | Imbabura | 13,764 | 17,775 | 21,286 | 25,115 | → |
| Cotacachi (Kutakachi) | Urban Place | Imbabura | 6,051 | 7,489 | 8,848 | 10,526 | → |
| Ibarra (San Miguel de Ibarra) | Urban Place | Imbabura | 80,991 | 108,535 | 131,856 | 157,941 | → |
| Otavalo (Utawalu) | Urban Place | Imbabura | 21,548 | 30,965 | 39,354 | 41,718 | → |
| Pimampiro (Pimampiru) | Urban Place | Imbabura | 4,950 | 4,654 | 5,138 | 5,848 | → |
| Urcuquí (Urkuki) | Urban Place | Imbabura | 1,870 | 2,796 | 3,298 | 4,480 | → |
Source: Instituto Nacional de Estadística y Censos del Ecuador (web).
Explanation: Census figures are not adjusted for underenumeration. The urban population of the corresponding parish is tabulated.