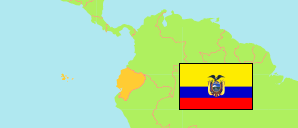
Zamora Chinchipe
Province in Ecuador
Contents: Subdivision
The population development in Zamora Chinchipe as well as related information and services (Wikipedia, Google, images).
| Name | Status | Population Census 1990-11-25 | Population Census 2001-11-25 | Population Census 2010-11-28 | Population Census 2022-10-01 | |
|---|---|---|---|---|---|---|
| Zamora Chinchipe (Zamora Chinchipi) | Province | 66,167 | 76,601 | 91,376 | 110,973 | |
| Centinela del Cóndor (Kunturchapana) | Canton | ... | 5,539 | 6,479 | 7,882 | → |
| Chinchipe (Chinchipi) | Canton | 12,419 | 8,495 | 9,119 | 10,337 | → |
| El Pangui (Panki) | Canton | ... | 7,441 | 8,619 | 12,768 | → |
| Nangaritza | Canton | 4,316 | 4,797 | 5,196 | 6,429 | → |
| Palanda (Palanta) | Canton | ... | 7,066 | 8,089 | 8,873 | → |
| Paquisha (Pakisha) | Canton | ... | 1,691 | 3,854 | 4,737 | → |
| Yacuambi (Yakuampi) | Canton | 3,448 | 5,229 | 5,835 | 6,391 | → |
| Yantzaza (Yanzatza) | Canton | 17,910 | 14,552 | 18,675 | 23,370 | → |
| Zamora | Canton | 28,074 | 21,791 | 25,510 | 30,186 | → |
| Ecuador | Republic | 9,697,979 | 12,156,608 | 14,483,499 | 16,938,986 |
Source: Instituto Nacional de Estadística y Censos del Ecuador.
Explanation: Census figures are not adjusted for underenumeration.
Further information about the population structure:
| Gender (C 2010) | |
|---|---|
| Males | 55,421 |
| Females | 55,552 |
| Age Groups (C 2010) | |
|---|---|
| 0-14 years | 35,081 |
| 15-64 years | 51,712 |
| 65+ years | 4,583 |
| Age Distribution (C 2010) | |
|---|---|
| 0-9 years | 23,105 |
| 10-19 years | 22,133 |
| 20-29 years | 15,104 |
| 30-39 years | 10,441 |
| 40-49 years | 8,198 |
| 50-59 years | 5,703 |
| 60-69 years | 3,836 |
| 70-79 years | 1,969 |
| 80+ years | 887 |
| Urbanization (C 2022) | |
|---|---|
| Rural | 59,549 |
| Urban | 51,424 |
| Ethnic Group (C 2010) | |
|---|---|
| Indigenous | 14,219 |
| Afro-Ecuadorian | 1,321 |
| Montubios | 210 |
| Mestizos | 73,397 |
| White | 1,909 |
| Other Ethnic Group | 320 |
| Literacy (A15+) (C 2010) | |
|---|---|
| yes | 53,180 |
| no | 3,115 |