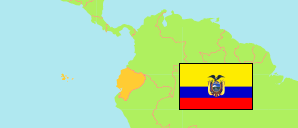
El Oro
Province in Ecuador
Contents: Subdivision
The population development in El Oro as well as related information and services (Wikipedia, Google, images).
| Name | Status | Population Census 1990-11-25 | Population Census 2001-11-25 | Population Census 2010-11-28 | Population Census 2022-10-01 | |
|---|---|---|---|---|---|---|
| El Oro (Kuri) | Province | 412,572 | 525,763 | 600,659 | 714,592 | |
| Arenillas (Arinillas) | Canton | 18,314 | 22,477 | 26,844 | 32,366 | → |
| Atahualpa (Atawallpa) | Canton | 6,134 | 5,479 | 5,833 | 6,112 | → |
| Balsas | Canton | 4,066 | 5,348 | 6,861 | 7,875 | → |
| Chilla | Canton | 2,767 | 2,665 | 2,484 | 2,251 | → |
| El Guabo (Wapu) | Canton | 28,058 | 41,078 | 50,009 | 59,536 | → |
| Huaquillas (Wakilla) | Canton | 27,806 | 40,285 | 48,285 | 56,303 | → |
| Las Lajas (Lajas) | Canton | 4,866 | 4,781 | 4,794 | 5,738 | → |
| Machala | Canton | 157,607 | 217,696 | 245,972 | 306,309 | → |
| Marcabelí (Markawili) | Canton | 4,889 | 4,930 | 5,450 | 6,870 | → |
| Pasaje | Canton | 51,406 | 62,959 | 72,806 | 83,597 | → |
| Piñas | Canton | 21,843 | 23,246 | 25,988 | 29,406 | → |
| Portovelo | Canton | 10,257 | 11,024 | 12,200 | 13,556 | → |
| Santa Rosa | Canton | 50,860 | 60,388 | 69,036 | 80,299 | → |
| Zaruma (Saruma) | Canton | 23,699 | 23,407 | 24,097 | 24,374 | → |
| Ecuador | Republic | 9,697,979 | 12,156,608 | 14,483,499 | 16,938,986 |
Source: Instituto Nacional de Estadística y Censos del Ecuador.
Explanation: Census figures are not adjusted for underenumeration.
Further information about the population structure:
| Gender (C 2010) | |
|---|---|
| Males | 353,211 |
| Females | 361,381 |
| Age Groups (C 2010) | |
|---|---|
| 0-14 years | 180,358 |
| 15-64 years | 382,228 |
| 65+ years | 38,073 |
| Age Distribution (C 2010) | |
|---|---|
| 0-9 years | 117,230 |
| 10-19 years | 122,156 |
| 20-29 years | 103,384 |
| 30-39 years | 85,729 |
| 40-49 years | 68,438 |
| 50-59 years | 48,648 |
| 60-69 years | 30,422 |
| 70-79 years | 16,530 |
| 80+ years | 8,122 |
| Urbanization (C 2022) | |
|---|---|
| Rural | 153,367 |
| Urban | 561,225 |
| Ethnic Group (C 2010) | |
|---|---|
| Indigenous | 4,060 |
| Afro-Ecuadorian | 41,441 |
| Montubios | 16,858 |
| Mestizos | 489,843 |
| White | 46,801 |
| Other Ethnic Group | 1,656 |
| Literacy (A15+) (C 2010) | |
|---|---|
| yes | 402,994 |
| no | 17,307 |