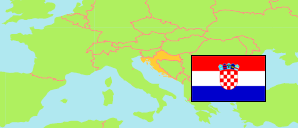
Draž
Municipality in Osijek-Baranja
Municipality
The population development of Draž.
| Name | Status | Population Census 2001-03-31 | Population Census 2011-03-31 | Population Census 2021-08-31 | |
|---|---|---|---|---|---|
| Draž | Municipality | 3,356 | 2,767 | 1,949 | → |
| Osijek-Baranja | County | 330,506 | 305,032 | 258,026 |
Contents: Settlements
The population development of the settlements in Draž.
| Name | Status | Municipality | Population Census 2001-03-31 | Population Census 2011-03-31 | Population Census 2021-08-31 | |
|---|---|---|---|---|---|---|
| Batina | Settlement | Draž | 1,048 | 879 | 594 | → |
| Draž | Settlement | Draž | 623 | 505 | 355 | → |
| Duboševica | Settlement | Draž | 690 | 554 | 393 | → |
| Gajić | Settlement | Draž | 354 | 294 | 232 | → |
| Podolje | Settlement | Draž | 168 | 140 | 88 | → |
| Topolje | Settlement | Draž | 473 | 395 | 287 | → |
Source: Croatian Bureau of Statistics (web).
Explanation: Area figures are computed by using geospatial data.