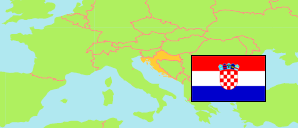
Brod-Posavina
County in Croatia
Contents: Subdivision
The population development in Brod-Posavina as well as related information and services (Wikipedia, Google, images).
| Name | Status | Population Census 2001-03-31 | Population Census 2011-03-31 | Population Census 2021-08-31 | |
|---|---|---|---|---|---|
| Brod-Posavina | County | 176,765 | 158,575 | 130,267 | |
| Bebrina | Municipality | 3,541 | 3,252 | 2,817 | → |
| Brodski Stupnik | Municipality | 3,526 | 3,036 | 2,357 | → |
| Bukovlje | Municipality | 3,005 | 3,108 | 2,727 | → |
| Cernik | Municipality | 4,235 | 3,640 | 2,964 | → |
| Davor | Municipality | 3,259 | 3,015 | 2,529 | → |
| Donji Andrijevci | Municipality | 4,393 | 3,709 | 3,059 | → |
| Dragalić | Municipality | 1,282 | 1,361 | 1,058 | → |
| Garčin | Municipality | 5,320 | 4,806 | 3,951 | → |
| Gornja Vrba | Municipality | 2,559 | 2,512 | 2,168 | → |
| Gornji Bogićevci | Municipality | 2,319 | 1,975 | 1,428 | → |
| Gundinci | Municipality | 2,294 | 2,027 | 1,610 | → |
| Klakar | Municipality | 2,417 | 2,319 | 2,020 | → |
| Nova Gradiška | Town | 15,833 | 14,229 | 11,690 | → |
| Nova Kapela | Municipality | 5,118 | 4,227 | 3,393 | → |
| Okučani | Municipality | 4,224 | 3,447 | 2,323 | → |
| Oprisavci | Municipality | 2,636 | 2,508 | 1,968 | → |
| Oriovac | Municipality | 6,559 | 5,824 | 4,770 | → |
| Podcrkavlje | Municipality | 2,683 | 2,553 | 2,207 | → |
| Rešetari | Municipality | 5,171 | 4,753 | 3,852 | → |
| Sibinj | Municipality | 7,549 | 6,895 | 5,730 | → |
| Sikirevci | Municipality | 2,707 | 2,476 | 2,028 | → |
| Slavonski Brod | Town | 64,612 | 59,141 | 49,891 | → |
| Slavonski Šamac | Municipality | 2,649 | 2,169 | 1,576 | → |
| Stara Gradiška | Municipality | 1,717 | 1,363 | 911 | → |
| Staro Petrovo Selo | Municipality | 6,352 | 5,186 | 4,110 | → |
| Velika Kopanica | Municipality | 3,876 | 3,308 | 2,621 | → |
| Vrbje | Municipality | 2,906 | 2,215 | 1,691 | → |
| Vrpolje | Municipality | 4,023 | 3,521 | 2,818 | → |
| Hrvatska [Croatia] | Republic | 4,437,460 | 4,284,889 | 3,871,833 |
Source: Croatian Bureau of Statistics (web).
Explanation: Area figures are derived from geospatial data.
Further information about the population structure:
| Gender (C 2021) | |
|---|---|
| Males | 63,451 |
| Females | 66,816 |
| Age Groups (C 2021) | |
|---|---|
| 0-14 years | 18,574 |
| 15-64 years | 82,233 |
| 65+ years | 29,460 |
| Age Distribution (C 2021) | |
|---|---|
| 90+ years | 687 |
| 80-89 years | 6,580 |
| 70-79 years | 12,401 |
| 60-69 years | 20,378 |
| 50-59 years | 19,265 |
| 40-49 years | 15,849 |
| 30-39 years | 14,381 |
| 20-29 years | 14,957 |
| 10-19 years | 14,068 |
| 0-9 years | 11,701 |
| Citizenship (C 2021) | |
|---|---|
| Croatian | 129,871 |
| Foreign Citizenship / Stateless | 391 |
| Ethnic Group (C 2021) | |
|---|---|
| Croats | 124,804 |
| Serbs | 2,170 |
| Other group | 2,141 |
| Religion (C 2021) | |
|---|---|
| Catholic | 113,940 |
| Orthodox | 3,832 |
| Other Christians | 5,743 |
| Muslim | 907 |
| Other religion | 500 |
| No religion | 2,892 |