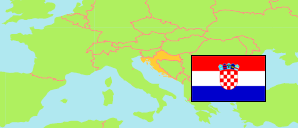
Virovitica-Podravina
County in Croatia
Contents: Subdivision
The population development in Virovitica-Podravina as well as related information and services (Wikipedia, Google, images).
| Name | Status | Population Census 2001-03-31 | Population Census 2011-03-31 | Population Census 2021-08-31 | |
|---|---|---|---|---|---|
| Virovitica-Podravina | County | 93,389 | 84,836 | 70,368 | |
| Čačinci | Municipality | 3,308 | 2,802 | 2,162 | → |
| Čađavica | Municipality | 2,394 | 2,009 | 1,555 | → |
| Crnac | Municipality | 1,772 | 1,456 | 1,116 | → |
| Gradina | Municipality | 4,485 | 3,850 | 2,874 | → |
| Lukač | Municipality | 4,276 | 3,634 | 2,759 | → |
| Mikleuš | Municipality | 1,701 | 1,464 | 1,067 | → |
| Nova Bukovica | Municipality | 2,096 | 1,771 | 1,275 | → |
| Orahovica | Town | 5,792 | 5,304 | 4,537 | → |
| Pitomača | Municipality | 10,465 | 10,059 | 8,402 | → |
| Slatina | Town | 14,819 | 13,686 | 11,503 | → |
| Sopje | Municipality | 2,750 | 2,320 | 1,897 | → |
| Špišić Bukovica | Municipality | 4,733 | 4,221 | 3,303 | → |
| Suhopolje | Municipality | 7,524 | 6,683 | 5,267 | → |
| Virovitica | Town | 22,618 | 21,291 | 19,302 | → |
| Voćin | Municipality | 2,421 | 2,382 | 1,896 | → |
| Zdenci | Municipality | 2,235 | 1,904 | 1,453 | → |
| Hrvatska [Croatia] | Republic | 4,437,460 | 4,284,889 | 3,871,833 |
Source: Croatian Bureau of Statistics (web).
Explanation: Area figures are derived from geospatial data.
Further information about the population structure:
| Gender (C 2021) | |
|---|---|
| Males | 33,989 |
| Females | 36,379 |
| Age Groups (C 2021) | |
|---|---|
| 0-14 years | 9,925 |
| 15-64 years | 44,977 |
| 65+ years | 15,466 |
| Age Distribution (C 2021) | |
|---|---|
| 90+ years | 388 |
| 80-89 years | 3,155 |
| 70-79 years | 6,707 |
| 60-69 years | 11,149 |
| 50-59 years | 10,725 |
| 40-49 years | 8,879 |
| 30-39 years | 8,068 |
| 20-29 years | 7,712 |
| 10-19 years | 7,302 |
| 0-9 years | 6,283 |
| Citizenship (C 2021) | |
|---|---|
| Croatian | 70,123 |
| Foreign Citizenship / Stateless | 244 |
| Ethnic Group (C 2021) | |
|---|---|
| Croats | 65,581 |
| Serbs | 3,168 |
| Other group | 845 |
| Religion (C 2021) | |
|---|---|
| Catholic | 60,387 |
| Orthodox | 3,263 |
| Other Christians | 2,806 |
| Muslim | 251 |
| Other religion | 355 |
| No religion | 2,017 |