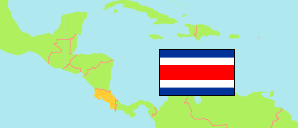
Mata de Plátano
District in Costa Rica
Contents: Population
The population development of Mata de Plátano as well as related information and services (Wikipedia, Google, images).
| Name | Status | Population Estimate 2000-06-30 | Population Estimate 2011-06-30 | Population Projection 2020-06-30 | |
|---|---|---|---|---|---|
| Mata de Plátano | District | 16,501 | 18,984 | 20,848 | |
| Costa Rica | Republic | 3,872,343 | 4,592,147 | 5,111,221 |
Source: Instituto Nacional de Estadística y Censos.
Further information about the population structure:
| Gender (P 2020) | |
|---|---|
| Males | 10,261 |
| Females | 10,587 |
| Age Groups (P 2020) | |
|---|---|
| 0-14 years | 3,832 |
| 15-64 years | 14,734 |
| 65+ years | 2,282 |
| Age Distribution (P 2020) | |
|---|---|
| 0-9 years | 2,528 |
| 10-19 years | 2,715 |
| 20-29 years | 3,390 |
| 30-39 years | 3,726 |
| 40-49 years | 2,671 |
| 50-59 years | 2,416 |
| 60-69 years | 1,987 |
| 70+ years | 1,415 |
| Urbanization (C 2011) | |
|---|---|
| Rural | 122 |
| Urban | 17,248 |