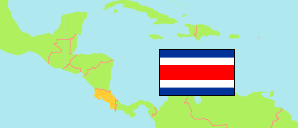
Alajuela
Canton in Costa Rica
Contents: Subdivision
The population development in Alajuela as well as related information and services (Wikipedia, Google, images).
| Name | Status | Population Estimate 2000-06-30 | Population Estimate 2011-06-30 | Population Projection 2020-06-30 | |
|---|---|---|---|---|---|
| Alajuela | Canton | 226,649 | 276,794 | 314,209 | |
| Alajuela | District | 43,543 | 45,895 | 48,078 | → |
| Carrizal | District | 6,570 | 7,518 | 8,739 | → |
| Desamparados | District | 21,449 | 28,271 | 32,717 | → |
| Garita (La Garita) | District | 6,970 | 8,142 | 9,259 | → |
| Guácima | District | 15,724 | 22,067 | 25,828 | → |
| Río Segundo | District | 11,213 | 11,629 | 13,228 | → |
| Sabanilla | District | 8,472 | 10,181 | 11,992 | → |
| San Antonio | District | 22,472 | 26,770 | 30,790 | → |
| San Isidro | District | 16,522 | 18,948 | 21,934 | → |
| San José de Alajuela | District | 36,009 | 44,897 | 51,344 | → |
| San Rafael | District | 19,565 | 28,839 | 33,273 | → |
| Sarapiquí | District | 2,534 | 3,334 | 3,907 | → |
| Tambor | District | 9,521 | 11,936 | 13,909 | → |
| Turrúcares | District | 6,085 | 8,367 | 9,211 | → |
| Costa Rica | Republic | 3,872,343 | 4,592,147 | 5,111,221 |
Source: Instituto Nacional de Estadística y Censos.
Further information about the population structure:
| Gender (P 2020) | |
|---|---|
| Males | 159,290 |
| Females | 154,919 |
| Age Groups (P 2020) | |
|---|---|
| 0-14 years | 65,812 |
| 15-64 years | 220,200 |
| 65+ years | 28,197 |
| Age Distribution (P 2020) | |
|---|---|
| 0-9 years | 43,448 |
| 10-19 years | 44,291 |
| 20-29 years | 49,989 |
| 30-39 years | 56,192 |
| 40-49 years | 42,006 |
| 50-59 years | 35,657 |
| 60-69 years | 25,221 |
| 70+ years | 17,405 |
| Urbanization (C 2011) | |
|---|---|
| Rural | 30,612 |
| Urban | 224,274 |