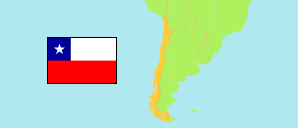
Chiloé
Province in Chile
Contents: Subdivision
The population development in Chiloé as well as related information and services (Wikipedia, Google, images).
| Name | Status | Population Estimate 2002-07-01 | Population Estimate 2007-07-01 | Population Estimate 2012-07-01 | Population Estimate 2017-07-01 | Population Projection 2023-07-01 | |
|---|---|---|---|---|---|---|---|
| Chiloé | Province | 160,342 | 167,655 | 174,034 | 178,342 | 183,347 | |
| Ancud | Municipality | 41,332 | 41,507 | 42,012 | 42,231 | 42,516 | → |
| Castro | Municipality | 40,982 | 43,057 | 45,075 | 46,390 | 48,482 | → |
| Chonchi | Municipality | 12,999 | 13,909 | 14,872 | 15,683 | 16,213 | → |
| Curaco de Vélez | Municipality | 3,511 | 3,685 | 3,860 | 3,989 | 4,120 | → |
| Dalcahue | Municipality | 11,202 | 13,064 | 14,035 | 14,689 | 15,368 | → |
| Puqueldón | Municipality | 4,292 | 4,227 | 4,217 | 4,197 | 4,191 | → |
| Queilén | Municipality | 5,342 | 5,401 | 5,486 | 5,518 | 5,543 | → |
| Quellón | Municipality | 22,553 | 25,202 | 27,097 | 28,499 | 29,942 | → |
| Quemchi | Municipality | 8,887 | 8,798 | 8,808 | 8,777 | 8,760 | → |
| Quinchao | Municipality | 9,242 | 8,805 | 8,572 | 8,369 | 8,212 | → |
| Chile | Republic | 15,691,701 | 16,517,933 | 17,443,491 | 18,419,192 | 19,960,889 |
Source: Instituto Nacional de Estadísticas.
Explanation: All tabulated population figures consider the results of the 2017 census.
Further information about the population structure:
| Gender (P 2023) | |
|---|---|
| Males | 91,390 |
| Females | 91,957 |
| Age Groups (P 2023) | |
|---|---|
| 0-17 years | 41,432 |
| 18-64 years | 116,132 |
| 65+ years | 25,783 |
| Age Distribution (P 2023) | |
|---|---|
| 80+ years | 6,409 |
| 70-79 years | 11,123 |
| 60-69 years | 18,099 |
| 50-59 years | 24,906 |
| 40-49 years | 26,984 |
| 30-39 years | 28,635 |
| 20-29 years | 21,736 |
| 10-19 years | 24,465 |
| 0-9 years | 20,990 |
| Urbanization (C 2017) | |
|---|---|
| Rural | 65,998 |
| Urban | 102,187 |
| Country of Birth (C 2017) | |
|---|---|
| Chile | 166,145 |
| South America | 1,627 |
| Central America & Caribbean | 153 |
| North America | 47 |
| Europe | 153 |
| Other country & undeclared | 60 |