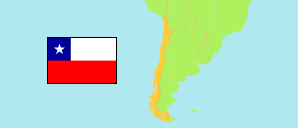
Cautín
Province in Chile
Contents: Subdivision
The population development in Cautín as well as related information and services (Wikipedia, Google, images).
| Name | Status | Population Estimate 2002-07-01 | Population Estimate 2007-07-01 | Population Estimate 2012-07-01 | Population Estimate 2017-07-01 | Population Projection 2023-07-01 | |
|---|---|---|---|---|---|---|---|
| Cautín | Province | 695,522 | 721,813 | 752,618 | 781,572 | 812,032 | |
| Carahue | Municipality | 26,532 | 25,581 | 25,346 | 25,369 | 25,514 | → |
| Cholchol | Municipality | 10,244 | 10,853 | 11,472 | 12,023 | 12,578 | → |
| Cunco | Municipality | 19,483 | 18,393 | 18,050 | 17,992 | 18,067 | → |
| Curarrehue | Municipality | 7,098 | 7,291 | 7,508 | 7,694 | 7,860 | → |
| Freire | Municipality | 24,852 | 24,839 | 25,054 | 25,278 | 25,487 | → |
| Galvarino | Municipality | 13,094 | 12,790 | 12,679 | 12,628 | 12,588 | → |
| Gorbea | Municipality | 15,814 | 15,370 | 15,209 | 15,140 | 15,098 | → |
| Lautaro | Municipality | 33,592 | 35,598 | 37,691 | 39,614 | 41,624 | → |
| Loncoche | Municipality | 24,180 | 24,143 | 24,349 | 24,571 | 24,784 | → |
| Melipeuco | Municipality | 5,813 | 5,912 | 6,054 | 6,185 | 6,309 | → |
| Nueva Imperial | Municipality | 30,949 | 31,502 | 32,427 | 33,273 | 34,077 | → |
| Padre Las Casas | Municipality | 62,108 | 67,838 | 73,661 | 79,019 | 84,619 | → |
| Perquenco | Municipality | 6,724 | 6,848 | 7,005 | 7,142 | 7,262 | → |
| Pitrufquén | Municipality | 22,792 | 23,676 | 24,649 | 25,549 | 26,499 | → |
| Pucón | Municipality | 21,907 | 24,576 | 26,913 | 28,796 | 30,508 | → |
| Saavedra (Puerto Saavedra) | Municipality | 14,490 | 13,564 | 13,112 | 12,863 | 12,693 | → |
| Temuco | Municipality | 257,329 | 270,331 | 283,768 | 295,839 | 308,175 | → |
| Teodoro Schmidt | Municipality | 15,900 | 15,718 | 15,713 | 15,740 | 15,759 | → |
| Toltén | Municipality | 11,606 | 10,774 | 10,358 | 10,126 | 9,966 | → |
| Vilcún | Municipality | 23,390 | 25,050 | 27,052 | 29,265 | 32,238 | → |
| Villarrica | Municipality | 47,625 | 51,166 | 54,548 | 57,466 | 60,327 | → |
| Chile | Republic | 15,691,701 | 16,517,933 | 17,443,491 | 18,419,192 | 19,960,889 |
Source: Instituto Nacional de Estadísticas.
Explanation: All tabulated population figures consider the results of the 2017 census.
Further information about the population structure:
| Gender (P 2023) | |
|---|---|
| Males | 396,257 |
| Females | 415,775 |
| Age Groups (P 2023) | |
|---|---|
| 0-17 years | 188,801 |
| 18-64 years | 504,319 |
| 65+ years | 118,912 |
| Age Distribution (P 2023) | |
|---|---|
| 80+ years | 29,688 |
| 70-79 years | 51,119 |
| 60-69 years | 81,948 |
| 50-59 years | 101,493 |
| 40-49 years | 109,552 |
| 30-39 years | 115,494 |
| 20-29 years | 112,829 |
| 10-19 years | 109,856 |
| 0-9 years | 100,053 |
| Urbanization (C 2017) | |
|---|---|
| Rural | 224,613 |
| Urban | 527,487 |
| Country of Birth (C 2017) | |
|---|---|
| Chile | 742,570 |
| South America | 7,194 |
| Central America & Caribbean | 609 |
| North America | 272 |
| Europe | 1,049 |
| Other country & undeclared | 406 |