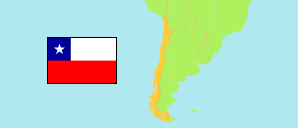
Linares
Province in Chile
Contents: Subdivision
The population development in Linares as well as related information and services (Wikipedia, Google, images).
| Name | Status | Population Estimate 2002-07-01 | Population Estimate 2007-07-01 | Population Estimate 2012-07-01 | Population Estimate 2017-07-01 | Population Projection 2023-07-01 | |
|---|---|---|---|---|---|---|---|
| Linares | Province | 263,521 | 273,621 | 285,423 | 298,858 | 315,332 | |
| Colbún | Municipality | 18,362 | 19,324 | 20,446 | 21,704 | 23,262 | → |
| Linares | Municipality | 86,614 | 89,780 | 93,647 | 98,039 | 103,303 | → |
| Longaví | Municipality | 28,982 | 29,721 | 30,716 | 31,924 | 33,467 | → |
| Parral | Municipality | 39,240 | 40,333 | 41,747 | 43,412 | 45,347 | → |
| Retiro | Municipality | 19,067 | 19,431 | 19,950 | 20,592 | 21,397 | → |
| San Javier (de Loncomilla) | Municipality | 39,458 | 42,246 | 44,848 | 47,583 | 50,985 | → |
| Villa Alegre | Municipality | 15,214 | 15,673 | 16,273 | 16,992 | 17,913 | → |
| Yerbas Buenas | Municipality | 16,584 | 17,113 | 17,796 | 18,612 | 19,658 | → |
| Chile | Republic | 15,691,701 | 16,517,933 | 17,443,491 | 18,419,192 | 19,960,889 |
Source: Instituto Nacional de Estadísticas.
Explanation: All tabulated population figures consider the results of the 2017 census.
Further information about the population structure:
| Gender (P 2023) | |
|---|---|
| Males | 154,238 |
| Females | 161,094 |
| Age Groups (P 2023) | |
|---|---|
| 0-17 years | 71,835 |
| 18-64 years | 192,386 |
| 65+ years | 51,111 |
| Age Distribution (P 2023) | |
|---|---|
| 80+ years | 11,424 |
| 70-79 years | 22,858 |
| 60-69 years | 36,000 |
| 50-59 years | 42,103 |
| 40-49 years | 42,953 |
| 30-39 years | 43,423 |
| 20-29 years | 37,628 |
| 10-19 years | 40,357 |
| 0-9 years | 38,586 |
| Urbanization (C 2017) | |
|---|---|
| Rural | 104,101 |
| Urban | 182,260 |
| Country of Birth (C 2017) | |
|---|---|
| Chile | 284,466 |
| South America | 1,209 |
| Central America & Caribbean | 224 |
| North America | 63 |
| Europe | 253 |
| Other country & undeclared | 146 |