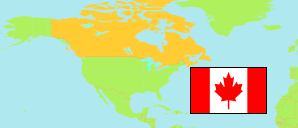
Northwest Territories
Territory in Canada
Contents: Subdivision
The population development in Northwest Territories as well as related information and services (Wikipedia, Google, images).
| Name | Status | Population Estimate 2002-07-01 | Population Estimate 2007-07-01 | Population Estimate 2012-07-01 | Population Estimate 2017-07-01 | Population Estimate 2022-07-01 | |
|---|---|---|---|---|---|---|---|
| Northwest Territories | Territory | 41,694 | 43,372 | 43,648 | 44,891 | 45,605 | |
| Region 1 (Beaufort Delta) | Region | 6,929 | 7,054 | 6,863 | 6,739 | 6,673 | → |
| Region 2 (Sahtu) | Region | 2,547 | 2,558 | 2,500 | 2,544 | 2,436 | → |
| Region 3 (Tłicho) | Region | 2,762 | 2,889 | 2,920 | 2,919 | 2,679 | → |
| Region 4 (Dehcho) | Region | 3,328 | 3,426 | 3,373 | 3,376 | 3,359 | → |
| Region 5 (South Slave) | Region | 6,949 | 7,237 | 7,350 | 7,356 | 6,821 | → |
| Region 6 (Yellowknife) | Region | 19,179 | 20,208 | 20,642 | 21,957 | 23,637 | → |
| Canada | Country | 31,358,418 | 32,889,025 | 34,714,222 | 36,545,236 | 38,929,902 |
Source: Statistics Canada (web).
Explanation: In contrast to census figures, population estimates are adjusted for underenumeration. 2022 figures are based on the 2016 census.
Further information about the population structure:
| Gender (E 2022) | |
|---|---|
| Males | 23,510 |
| Females | 22,095 |
| Age Groups (E 2022) | |
|---|---|
| 0-14 years | 8,783 |
| 15-64 years | 32,237 |
| 65+ years | 4,585 |
| Age Distribution (E 2022) | |
|---|---|
| 90+ years | 75 |
| 80-89 years | 467 |
| 70-79 years | 1,965 |
| 60-69 years | 4,775 |
| 50-59 years | 6,451 |
| 40-49 years | 6,247 |
| 30-39 years | 7,178 |
| 20-29 years | 6,795 |
| 10-19 years | 5,866 |
| 0-9 years | 5,786 |
| Country of Birth (C 2021) | |
|---|---|
| Canada | 35,575 |
| America | 485 |
| Europe | 830 |
| Africa | 855 |
| Asia | 2,550 |
| Oceania | 75 |
| Mother Tongue (C 2021) | |
|---|---|
| English | 30,795 |
| French | 1,130 |
| Indigenous language | 3,705 |
| Other language | 3,220 |
| Multiple languages | 1,705 |