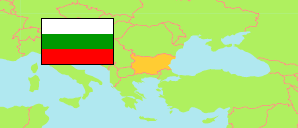
Bobovdol
Municipality in Bulgaria
Contents: Population
The population development of Bobovdol as well as related information and services (Wikipedia, Google, images).
| Name | Status | Native | Population Census 2001-03-01 | Population Census 2011-02-01 | Population Census 2021-09-07 | |
|---|---|---|---|---|---|---|
| Bobovdol | Municipality | Бобов дол | 11,755 | 9,067 | 6,862 | |
| Bǎlgarija [Bulgaria] | Republic | България | 7,932,984 | 7,364,570 | 6,519,789 |
Source: National Statistical Institute Bulgaria (web).
Further information about the population structure:
| Gender (C 2021) | |
|---|---|
| Males | 3,491 |
| Females | 3,371 |
| Age Groups (C 2021) | |
|---|---|
| 0-14 years | 643 |
| 15-64 years | 4,308 |
| 65+ years | 1,911 |
| Age Distribution (C 2021) | |
|---|---|
| 80+ years | 436 |
| 70-79 years | 962 |
| 60-69 years | 1,146 |
| 50-59 years | 1,227 |
| 40-49 years | 850 |
| 30-39 years | 777 |
| 20-29 years | 548 |
| 10-19 years | 510 |
| 0-9 years | 406 |
| Ethnic Group (C 2021) | |
|---|---|
| Bulgarians | 6,601 |
| Turks | 11 |
| Roma | 123 |
| other / indefinable | 42 |
| Mother Tongue (C 2021) | |
|---|---|
| Bulgarian | 6,643 |
| Turkish | 10 |
| Roma | 99 |
| other / indefinable | 32 |
| Religion (C 2021) | |
|---|---|
| Christian | 6,055 |
| Muslim | 37 |
| Other Religion | 2 |
| No Religion | 139 |