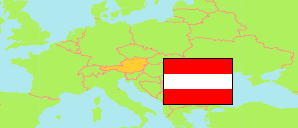
Lienz
District in Tirol (Austria)
Contents: Population
The population development of Lienz as well as related information and services (Wikipedia, Google, images).
| Name | Status | Population Census 1981-05-12 | Population Census 1991-05-15 | Population Census 2001-05-15 | Population Census 2011-10-31 | Population Census 2021-10-31 | Population Estimate 2024-01-01 | |
|---|---|---|---|---|---|---|---|---|
| Lienz | District | 47,494 | 48,338 | 50,395 | 49,319 | 48,872 | 48,847 | |
| Österreich [Austria] | Republic | 7,555,338 | 7,795,786 | 8,032,857 | 8,401,940 | 8,969,068 | 9,159,993 |
Source: Statistik Austria.
Explanation: 2024 population figures are preliminary estimates.
Further information about the population structure:
| Gender (E 2023) | |
|---|---|
| Males | 24,163 |
| Females | 24,691 |
| Age Groups (E 2023) | |
|---|---|
| 0-17 years | 8,564 |
| 18-64 years | 29,852 |
| 65+ years | 10,438 |
| Age Distribution (E 2023) | |
|---|---|
| 90+ years | 600 |
| 80-89 years | 2,769 |
| 70-79 years | 4,217 |
| 60-69 years | 6,586 |
| 50-59 years | 8,009 |
| 40-49 years | 5,992 |
| 30-39 years | 5,702 |
| 20-29 years | 5,360 |
| 10-19 years | 4,913 |
| 0-9 years | 4,706 |
| Citizenship (E 2023) | |
|---|---|
| Austria | 45,749 |
| EU, EEA, Switzerland | 2,254 |
| Other Citizenship | 851 |
| Country of Birth (E 2023) | |
|---|---|
| Austria | 45,072 |
| EU, EEA, Switzerland | 2,654 |
| Other country | 1,128 |