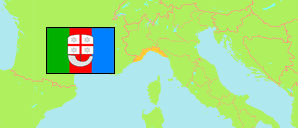
Provinces
The population of the provinces of Liguria according to census results and latest official estimates.
| Name | Abbr. | Status | Capital | Area A (km²) | Population Census (C) 1981-10-25 | Population Census (C) 1991-10-20 | Population Census (C) 2001-10-21 | Population Census (C) 2011-10-09 | Population Census (C) 2021-12-31 | Population Estimate (Ep) 2025-01-01 | ||
|---|---|---|---|---|---|---|---|---|---|---|---|---|
| Genova | MetProv | Genova | 1,834 | 1,045,109 | 950,849 | 878,082 | 855,834 | 817,402 | 818,651 | 183400 | → | |
| Imperia | Prov | Imperia | 1,155 | 223,738 | 213,587 | 205,238 | 214,502 | 208,670 | 209,152 | 115500 | → | |
| La Spezia | Prov | La Spezia | 881 | 241,371 | 227,199 | 215,935 | 219,330 | 215,117 | 214,986 | 88100 | → | |
| Savona | Prov | Savona | 1,546 | 297,675 | 284,647 | 272,528 | 281,028 | 268,038 | 267,119 | 154600 | → | |
| Liguria | LIG | Reg | Genova | 5,416 | 1,807,893 | 1,676,282 | 1,571,783 | 1,570,694 | 1,509,227 | 1,509,908 | 541600 | → |
| Italy | ITA | Rep | Roma | 302,068 | 56,556,911 | 56,778,031 | 56,995,744 | 59,433,744 | 59,030,133 | 58,934,177 | → |
- Istituto Nazionale di Statistica Italia.
Major Cities
| Name | Population Estimate (Ep) 2025-01-01 | |
|---|---|---|
| 1 | Genova | 563,947 |
| 2 | La Spezia | 92,711 |
| 3 | Savona | 58,690 |
| 4 | Sanremo | 53,033 |
| 5 | Imperia | 42,494 |
Contents: Cities & Communes
The population of all cities and communes in Liguria with more than 20,000 inhabitants according to census results and latest official estimates.
| Name | Population Census (C) 1981-10-25 | Population Census (C) 1991-10-20 | Population Census (C) 2001-10-21 | Population Census (C) 2011-10-09 | Population Census (C) 2021-12-31 | Population Estimate (Ep) 2025-01-01 | Area | |
|---|---|---|---|---|---|---|---|---|
| Albenga | 21,324 | 21,934 | 22,690 | 23,576 | 23,435 | 23,540 | 3658 | → |
| Chiavari | 30,082 | 28,584 | 27,476 | 27,338 | 27,228 | 27,442 | 1223 | → |
| Genova [Genoa] | 762,895 | 678,771 | 610,307 | 586,180 | 561,203 | 563,947 | 24029 | → |
| Imperia | 41,609 | 40,708 | 39,458 | 42,322 | 41,960 | 42,494 | 4538 | → |
| La Spezia | 115,392 | 101,442 | 91,391 | 92,659 | 92,169 | 92,711 | 5140 | → |
| Rapallo | 29,547 | 27,370 | 29,159 | 29,226 | 29,107 | 29,513 | 3362 | → |
| Sanremo (San Remo) | 61,170 | 56,003 | 50,608 | 54,137 | 52,918 | 53,033 | 5596 | → |
| Sarzana | 19,212 | 19,849 | 20,059 | 21,829 | 21,610 | 21,761 | 3454 | → |
| Savona | 75,353 | 67,177 | 59,907 | 60,661 | 58,534 | 58,690 | 6532 | → |
| Ventimiglia | 26,283 | 25,308 | 24,665 | 23,926 | 23,018 | 22,980 | 5373 | → |
- Istituto Nazionale di Statistica Italia.
Population Structure
Further information about the population structure.
| Gender (R 2025) | |
|---|---|
| Males | 731,614 |
| Females | 778,294 |
| Age Groups (R 2025) | |
|---|---|
| 0-17 years | 195,497 |
| 18-64 years | 873,766 |
| 65+ years | 440,645 |
| Age Distribution (R 2025) | |
|---|---|
| 90+ years | 32,369 |
| 80-89 years | 123,986 |
| 70-79 years | 180,624 |
| 60-69 years | 226,093 |
| 50-59 years | 251,115 |
| 40-49 years | 177,320 |
| 30-39 years | 152,648 |
| 20-29 years | 143,159 |
| 10-19 years | 127,239 |
| 0-9 years | 95,355 |
| Citizenship (R 2025) | |
|---|---|
| Italy | 1,345,781 |
| Foreign Citizenship | 164,127 |
